Property Data Engineering Sprint - Part 2
End-to-end dashboard and report development using Power BI and SSRS to visualize property trends and school-level insights in NSW.
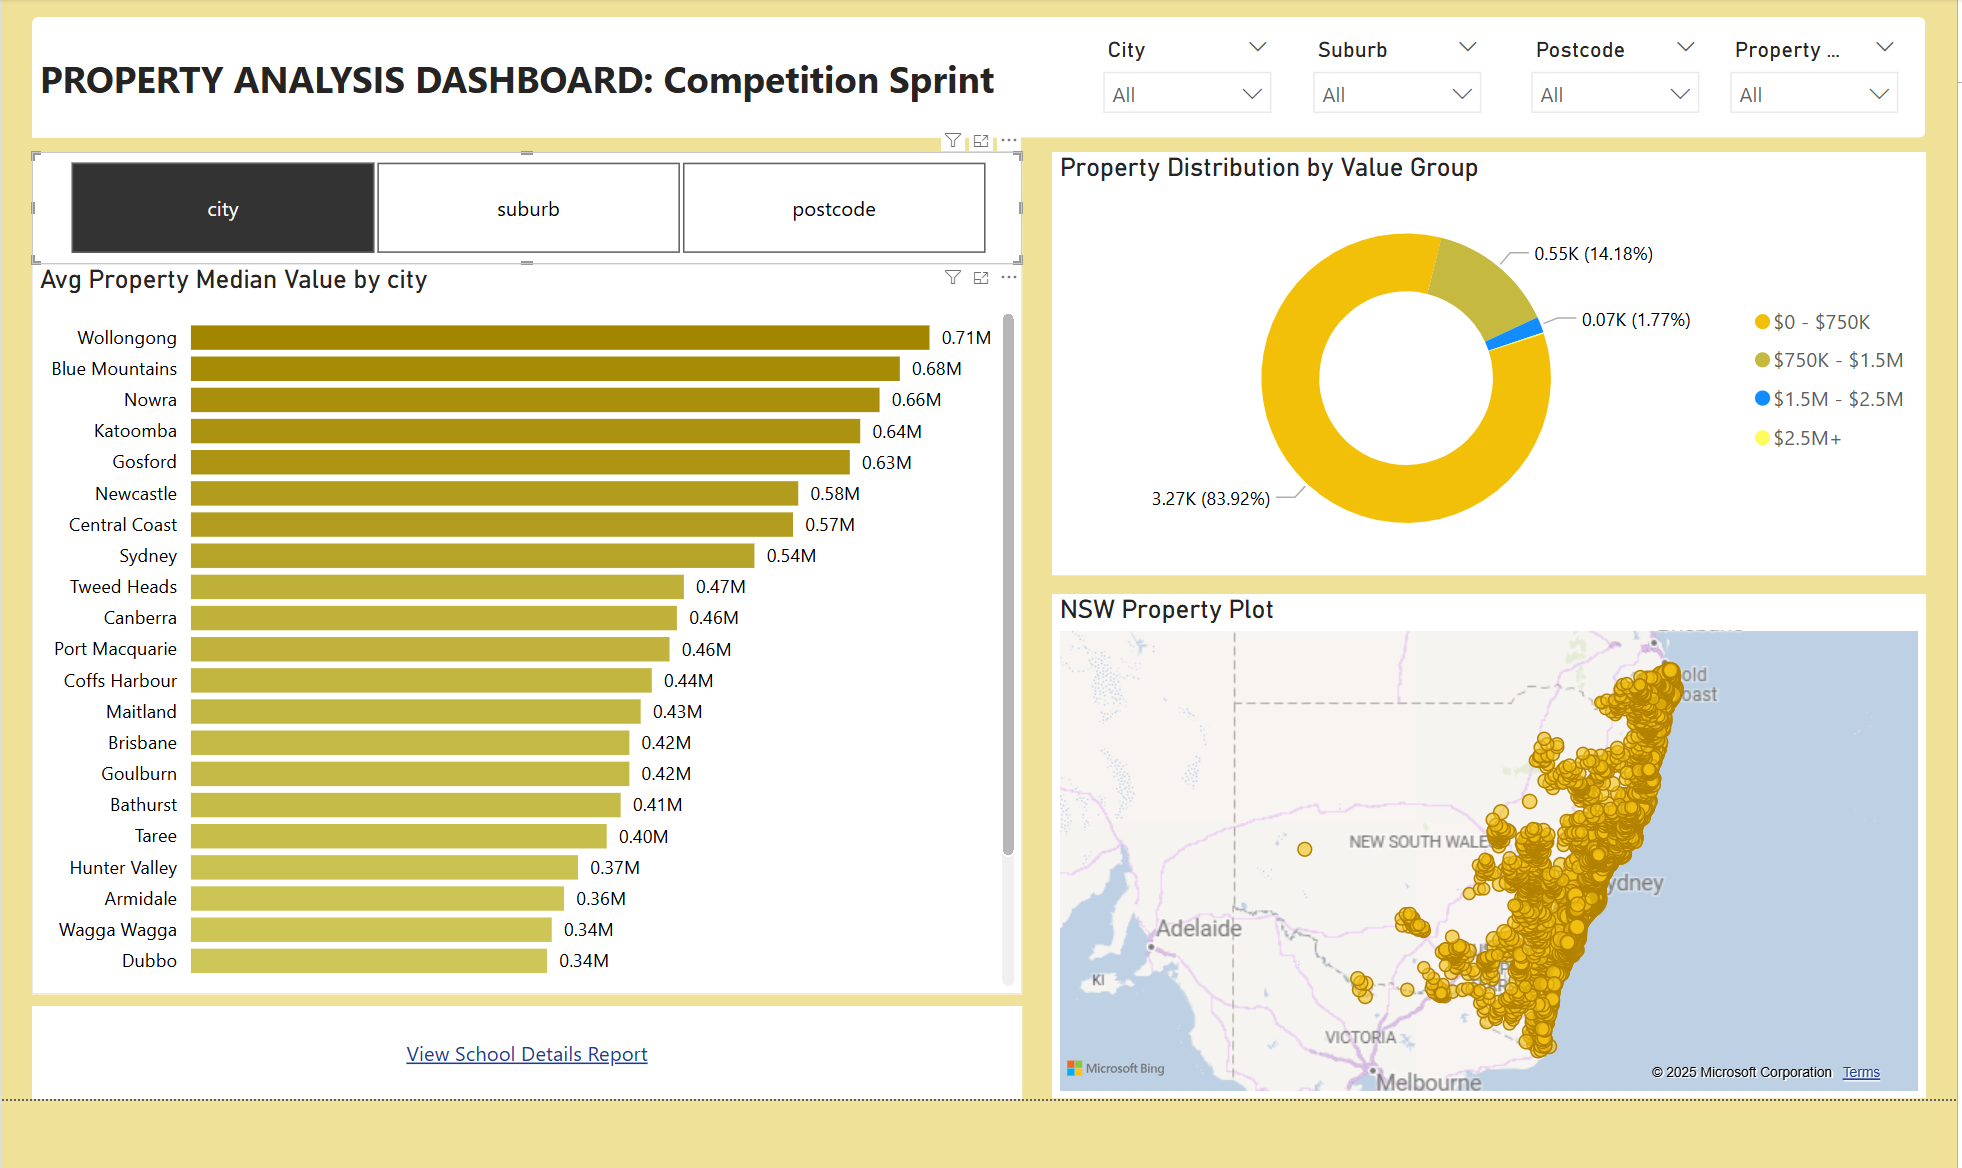
Power BI - Property Analysis Dashboard
Project Overview
- Objective: Design and develop visual reports using SSRS and Power BI to analyze public school demographics and property median values across NSW.
- Tools Used: Power BI, SSRS, SQL Server, DAX, T-SQL, Map Visualization, Interactive Filters
Problem Statement
Government analysts needed a dashboard to monitor property trends and public school conditions across New South Wales. The goal was to empower stakeholders with dynamic reports that could highlight regional property value distributions and provide school-level insight. The solution required implementing both tabular reporting via SSRS and interactive visualization using Power BI.
Reporting & Dashboard Features
SSRS Report
- Displays suburb, postcode, school name, type, ICSEA, and location
- Parameters to filter by Suburb and Postcode
- Formatted header with title/logo and footer with page number
- Exportable to Excel and PDF
Power BI Dashboard
- Connected to dimensional model in SQL Server (Star Schema)
- Visualizations for average property value by city, suburb, and postcode
- Bar chart for number of properties by value range
- Geographic map using latitude/longitude from Dim_Location
- Slicers for City, Suburb, Postcode, and Property Value Group
- Hyperlink to launch SSRS report from within Power BI
Key Insights
- Suburbs with the highest average property values were clustered near central business districts.
- ICSEA values correlated moderately with higher property values in suburban school catchments.
- Dashboards supported location-based filtering for school and property analysis at the suburb level.