Bank Loan Analysis Dashboard
Multi-platform dashboards to evaluate loan performance & risk metrics
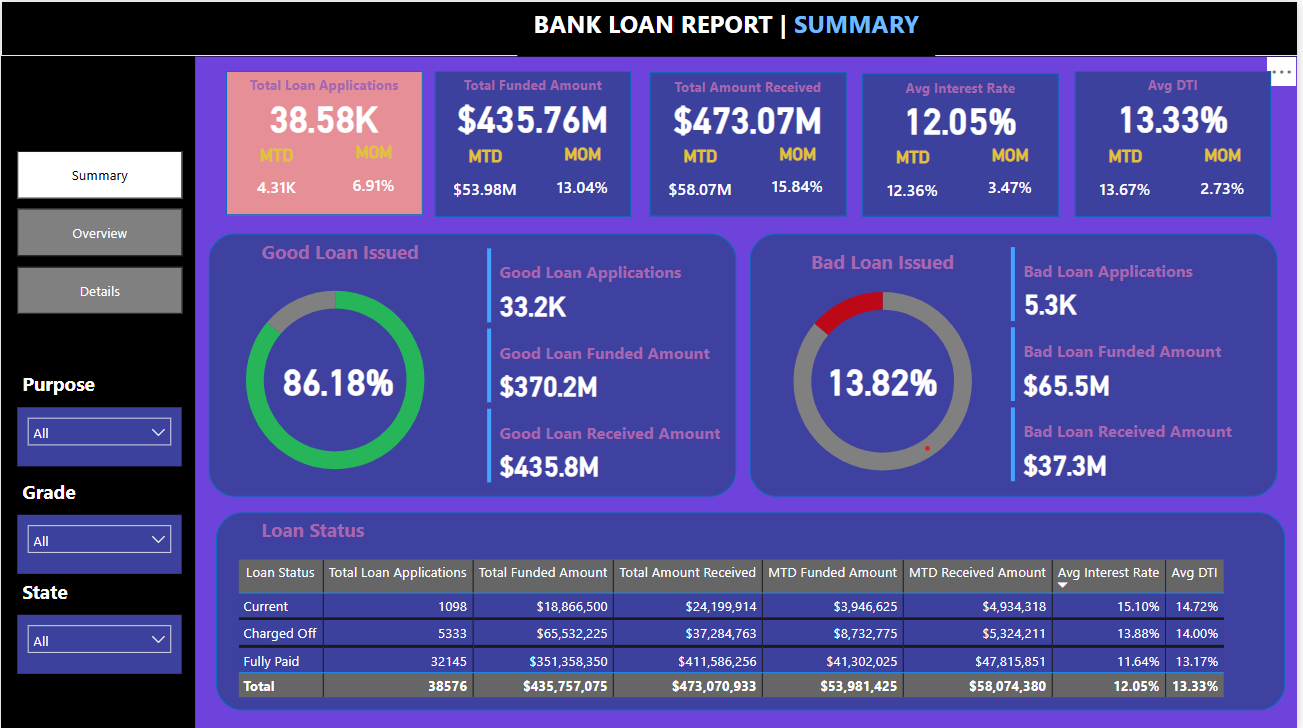
Summary Dashboard - KPI Overview
Project Overview
- Objective: Analyze bank loan data to track KPIs, identify trends, and assess loan performance.
- Tools Used: Excel, Power BI, Tableau, MsSQL
Problem Statement
The goal of this project was to create interactive dashboards that help monitor loan performance and key business metrics. It focused on tracking the total amount funded, repayments received, interest rates, and debt-to-income (DTI) ratios. The dashboards also highlighted trends in loan status and regional performance, with insights presented using month-to-date and month-over-month comparisons.
Dashboards & Visualizations
Dashboard 1: Summary Dashboard
High-level KPIs and loan status comparisons
- Total Loan Applications (MTD & MoM)
- Total Funded Amount (MTD & MoM)
- Total Amount Received (MTD & MoM)
- Average Interest Rate (MTD & MoM)
- Average DTI Ratio (MTD & MoM)
Good vs. Bad Loan KPIs: Application %, Funded Amount, and Received Amount comparisons
Loan Status Grid: Status-wise summary (e.g., Current, Fully Paid, Charged Off)
Dashboard 2: Overview Dashboard
Visual exploration of trends and demographics
- Monthly Trends by Issue Date (Line Chart)
- Regional Lending Activity (Filled Map)
- Loan Term Distribution (Donut Chart)
- Employment Length Analysis (Bar Chart)
- Loan Purpose Breakdown (Bar Chart)
- Home Ownership Patterns (Tree Map)
Dashboard 3: Details Dashboard
Granular data exploration with filters and export functionality.
- Interactive grid with filters for status, term, and region
- Search & sort capabilities
- Export to Excel option
Key Learnings & Insights
- California, Texas, and New York had the highest number of loan applications, with California showing the most defaults among the three.
- Borrowers with less than two years of employment history were more likely to default, making job stability a key risk factor.
- ‘Debt Consolidation’ and ‘Small Business’ were the most common reasons for taking out loans. Among them, loans for small businesses had the highest average funding.
- Loans with 60-month terms were repaid less often than those with 36-month terms, pointing to higher risk with longer durations.
- People who owned homes tended to repay their loans more reliably than those who rented, as seen in the home ownership breakdown.
- From one month to the next, loan applications went up by 12%, but the total funded amount dropped by 5%, which may point to stricter approval criteria or reduced funding capacity.
Links